Step 1
Go to ASSETS in the menu and go to trend graphs (or click anywhere on the image below) and select.
Note: This feature is only available at SITE level
Step 2
You can give your new Trend Graph page a title to keep things organized. (optional)
Step 3
Select a machine from the dropdown menu and choose a measurement point from the drop-down menu located on the right. You will only find the measurement points available at the machine. Then select a category for your machine from the dropdown menu on the left of the measurement point.

Step 4
Add more points if you wish to analyze more information at once by clicking on the ADD ANOTHER TRENDLINE button.
Note: Select up to 4 different measurement points and 2 different dimensions. If you would like to add more, please add a new trend graph below the existing one as explained here
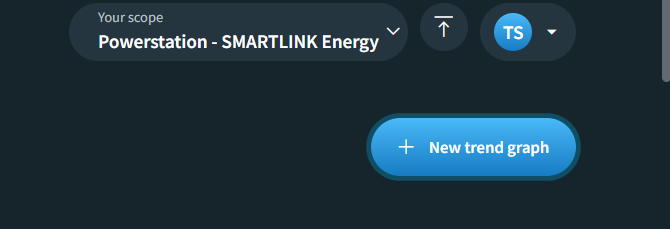
Step 5
To finish, click on the CREATE TREND GRAPH button.
Step 6
Well done! You created your first Trend Graph Page.